
[:it]Brillamenti e variabilità in DS Tucanae A e AU Mic. Lo studio: “Short-term variability of DS Tucanae A observed with TESS” di S. Colombo (INAF – OAPA) pubblicato su A&A[:en]Flares and variability in DS Tucanae A e AU Mic. The study: “Short-term variability of DS Tucanae A observed with TESS” of S. Colombo (INAF – OAPA) recently appeared on A&A[:]
[:it]La luminosità delle stelle non è costante nel tempo, ma varia con tempi scala che vanno dai minuti agli anni, in funzione dei fenomeni che inducono tale variabilità. Molti di questi fenomeni sono di origine magnetica, ossia prodotti dall’interazione tra campo magnetico e plasma nelle stelle. Alcuni esempi più importanti, osservati e studiati in dettaglio sul Sole, sono i brillamenti (improvvisi rilasci di grandi quantità di energia da parte del campo magnetico in corona, che riscalda il plasma confinato in strutture magnetiche fino ad alcuni milioni di gradi), le macchie fotosferiche (regioni della fotosfera più fredde del gas circostante), ed attività cromosferica come le protuberanze.
I fenomeni più energetici, come i brillamenti, sono accompagnati da un’intensa emissione impulsiva di radiazione ai raggi X ed UV. Questa radiazione è molto energetica, e può avere un impatto significativo sull’atmosfera di eventuali pianeti in orbite molto strette attorno alla stella: la radiazione UV viene assorbita dai gas negli strati più esterni dell’atmosfera, dissociandone le molecole, mentre la radiazione X penetra a profondità maggiori, inducendo un alto tasso di ionizzazione. Questo favorisce reazioni che influenzano le abbondanze chimiche nelle atmosfere, ne possono alterare i profili di temperatura e densità, e possono, nei casi più estremi, indurre una significativa evaporazione degli strati esterni delle atmosfere planetarie.
Campagne osservative come quella realizzata con il satellite della NASA TESS (Transiting Exoplanet Survey Satellite), che forniscono osservazioni ripetute con una cadenza di appena due minuti di un gran numero di stelle in quasi tutto il cielo, sono particolarmente importanti per lo studio dei fenomeni magnetici in stelle con pianeti. Il team di ricercatori guidato dall’astrofisico S. Colombo (INAF – Osservatorio Astronomico di Palermo) ha sviluppato una tecnica di analisi delle curve di luce prodotte da TESS (ossia delle misure del flusso di radiazione emesso dalla sorgente in funzione del tempo) mirata ad isolare i fenomeni di variabilità stellare su tempi scala molto brevi, principalmente brillamenti ed attività cromosferica. Queste misure, anche se eseguite in banda ottica, permettono in realtà di identificare gli eventi che producono una significativa emissione di radiazione energetica in banda X ed UV. Il metodo è stato applicato con successo su due stelle che ospitano pianeti: DS Tuc A, una stella G6V di 40 milioni di anni con un pianeta gassoso in orbita stretta, ed AU MIC, una stella M1 di 22 milioni di anni con due pianeti nettuniani ed un disco di polveri. In AU Mic sono stati identificati in media 5 eventi al giorno che hanno rilasciato un’energia maggiore di 5×1031 erg/sec (nel Sole i brillamenti rilasciano energie tipiche di circa 1027 erg/sec, con i casi più estremi e rari che raggiungono 1032 erg/sec), mentre in DS Tuc A la media è di due eventi al giorno con un’energia superiore a 2×1032 erg/sec. In particolare, in AU Mic gli eventi sembrano essere più frequenti in una fase specifica della rotazione della stella, suggerendo la presenza di una regione stabile sulla sua superficie magneticamente più attiva. Questo potrebbe essere la conseguenza di complicate, ed ancora non totalmente comprese, interazioni di tipo magnetico tra la stella ed i suoi pianeti. Allo studio, descritto nell’articolo: “Short-term variability of DS Tucanae A observed with TESS” e recentemente pubblicato sulla rivista Astronomy & Astrophysics, hanno partecipato anche gli astronomi A. Petralia e G. Micela dell’INAF – Osservatorio Astronomico di Palermo.
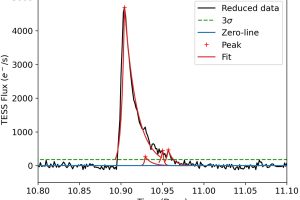
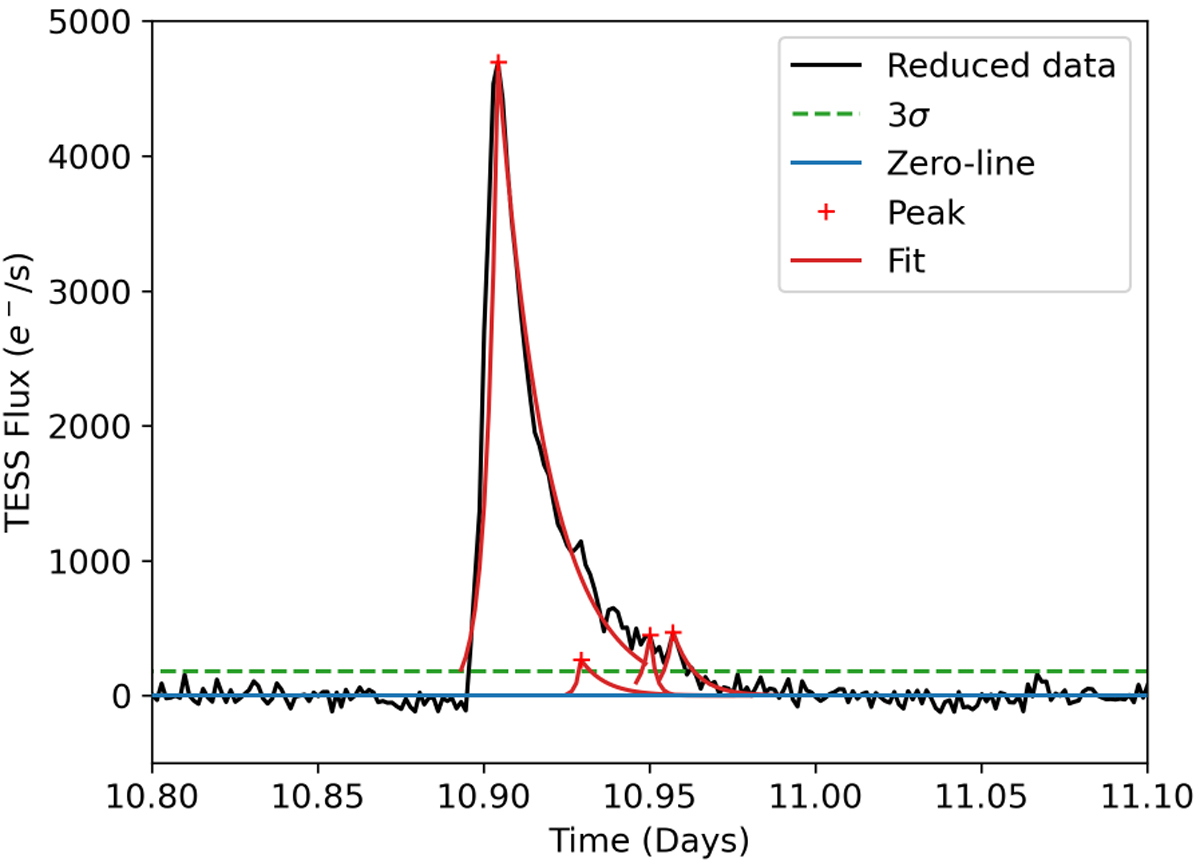
La figura (cliccare qui per visualizzare l’immagine interamente) mostra la curva di luce di uno dei brillamenti individuato dal team. La curva nera segue l’andamento del flusso emesso dalla sorgente, dove si vede l’aumento impulsivo di luminosità all’inizio del brillamento ed il suo declino nel tempo. Le curve rosse sono ottenute da funzioni analitiche che riproducono l’andamento osservato. La linea verde indica il valore di intensità zero. In questa curva di luce, infatti, è sottratto il contributo in quiescenza della stella (ossia quando non avvengono brillamenti), per cui prima e dopo l’evento la curva di luce è circa zero.
Mario Giuseppe Guarcello ( segui mguarce) ( youtube)
Segui la pagina Facebook dell’Osservatorio Astronomico di Palermo
Iscriviti al canale Youtube dell’Osservatorio Astronomico di Palermo[:en]Stars are variable sources over timescales which depend on the phenomena triggering this variability. These phenomena are typically produced by the interaction between the stellar magnetic field and its plasma. Typical examples, observed and studied in great details in the Sun, are: flares (sudden release of a large amount of energy by the magnetic field which heats the gas in the coronal magnetic structure up to million of degrees), stellar spots (dark regions in stellar photosphere where the plasma is colder than the surrounding gas), and chromospheric activity such as prominences.
The most energetic phenomena, such as flares, are sources of intense emission of X-rays and UV radiation. This readiation is very energetic, and it can impact the atmosphere of planets in close orbits nearby the star. The UV radiation, in fact, is absorbed by the gas in the outermost layers of the atmosphere, dissociating its molecules, while X-ray can penetrate deeper, increasing the ionization rate. This induces chemical reactions which change the chemical abundances in the atmosphere, it may affect its density and temperature profile, and, in the most extreme cases, it may induce the photoevaporation of the outermost layers of the planetary atmosphere.
Surveys such at the one performed with the NASA satellite TESS (Transiting Exoplanet Survey Satellite), which is producing continued observations with a cadence of only two minutes of a large number of stars across most of the sky, are of great importance to study the magnetic activity in stars with planets. The team of researchers led by the astronomer S. Colombo (INAF – Astronomical Observatory of Palermo) developed a tecnique aimed at identifying the stellar short-term variability events, mainly flares and chromospheric activity, from TESS light curves (which are the time variation of stellar luminosity). These measurements, even if made in optical band, allow to trace the most energetic events, which produce X-ray and UV radiation. The method has been succesfully applied in two stars with exoplanets: DS Tuc A, a G6V star 40 million of years old with a gaseous giant planet in a very close orbit, and AU Mic, a M1 star 22 million of years old hosting two Neptune-size planets and a debris disk. In AU Mic events have been recorded with a rate of five flares per day more energetic than 5×1031 erg/sec (in the Sun, for instance, flares typically release an energy of 1027 erg/sec, with the most extreme and rare events releasing up to 1032 erg/sec), while in DS Tuc A a rate of two events releasing about 2×1032 erg/sec of energy per day has been found. In particular, in AU Mic the observed flares are more frequent in a particular phase of stellar rotation, suggesting the presence of a stable magnetically active region in the stellar surface. This is likely induced by a complex, and to date not fully understood, magnetic connection between star and its planets. The study is described in the paper: “Short-term variability of DS Tucanae A observed with TESS“, recently published by the journal Astronomy & Astrophysics, with the collaboration of the astronomers A. Petralia and G. Micela of INAF – Astronomical Observatory of Palermo.
The figure (click here to visualize the entire image) shows an example of the light curve of one of the observed flares. The black line marks the observed time variability of the stellar flux, increasing quickly at the beggining of the flare, and then declining smoothly. The red curves are obtained from analytical functions used to describe the observed variability. The green line marks the zero intensity. In this curve, in fact, the quiescent level of stellar emission has been removed, so that the light curve is at about zero intensity before and after the flare.
Mario Giuseppe Guarcello ( follow mguarce) ( youtube)
Follow the Astronomical Observatory of Palermo on Facebok
Subscribe the Youtube channel of the Astronomical Observatory of Palermo[:]