New insight on the heating of plasma in coronal loops

The Solar corona is visible in the energetic bands of the electromagnetic spectrum as composed by magnetic arcs filled by plasma at million degrees, which are particularly bright in the active regions. Despite it is clear that the magnetic field plays a fundamental role in heating and confining the plasma, the Solar corona is still a complex region where energetic and violent phenomena such as the flares occur. Solar flares release an incredible amount of magnetic energy very quickly, making very difficult to study the mechanism behind the release of energy. Thus, astronomers often focus their attention on less energetic events which are more easy to observe and characterize. This is the case of some magnetic arcs observed in coronal active regions.
In this framework, the NASA satellite Interface Region Imaging Spectrograph (IRIS) has observed in the UV chromospheric regions which shine for a few minutes. The team led by F. Reale (University of Palermo and INAF – Astronomical Observatory of Palermo) has discovered that such bright points, which shine for about 10 minutes, are the foot of magnetic arcs anchored in the chromosphere, and they are the places where the plasma is heated up to 10 million degrees. In the study: “Impulsive coronal heating from large-scale magnetic rearrangements: from IRIS to SDO/AIA“, recently appeared on The Astrophysical Journal, F. Reale and his coauthors have analyzed observations made with the satellite Solar Dynamics Observatory, aimed at characterizing the structure of these arcs. They have demonstrated that these arcs are not parallel, bu they intersect each other. The natural explanation is that the resulting interaction between these magnetic structure due to the motion of the plasma in the photosphere trigger the release of energy by magnetic reconnection. This mechanism can occur both during flares and less energetic events, but in the latter case the interaction is more simple, allowing an easier interpretation of the observations.
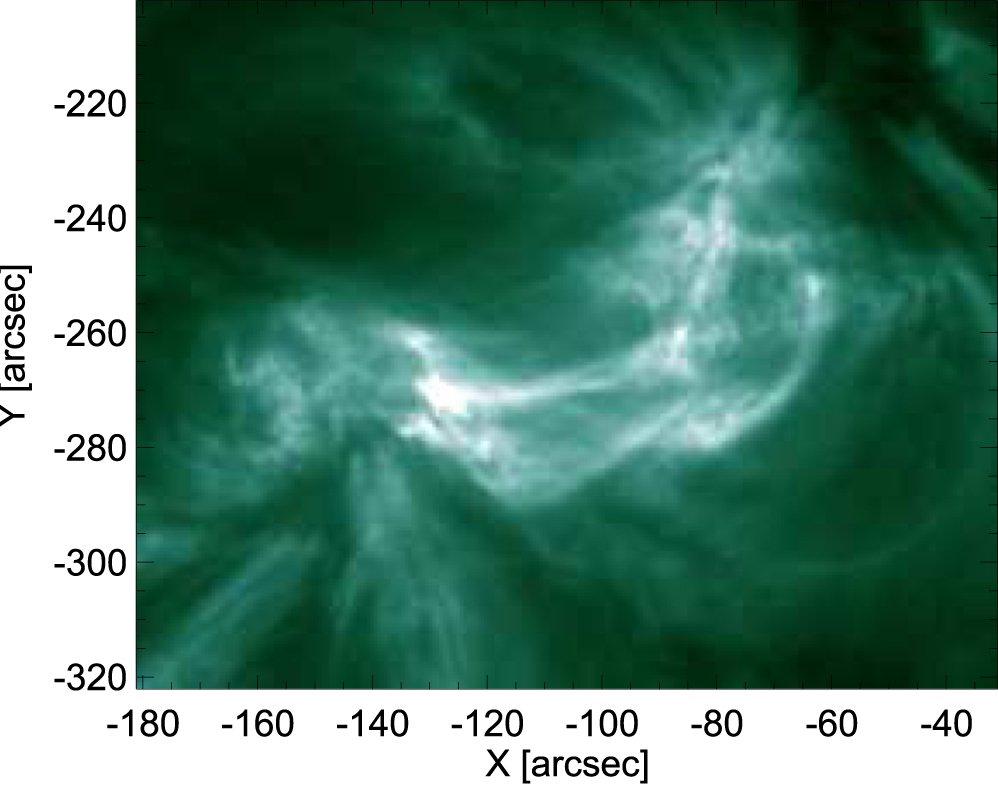
The figure (link) shows the flare occurred on 2015 November 12 and analyzed in this study.
by Mario Giuseppe Guarcello ( follow mguarce)